![]() Science News
Science News
A bit of science magic you can do with nothing more than your eyesWhen a color is By Wil Milan for explorezone.com |
 Pink-red color of the Orion Nebula indicates
ionized hydrogen. Blue in NGC 1973-75-77 indicates gas and dust
that is not ionized, but which reflects light. Image copyright
© Wil Milan. Pink-red color of the Orion Nebula indicates
ionized hydrogen. Blue in NGC 1973-75-77 indicates gas and dust
that is not ionized, but which reflects light. Image copyright
© Wil Milan. |
The reason you cannot look through such
telescopes is that they are not telescopes as most people think
of them, but really giant cameras. A photograph can capture objects
much fainter than the human eye can see, and a photograph is a
much more accurate record than the human mind or even a human
drawing (which is how astronomers used to record their observations).
For those reasons all major telescopes built since the early part
of this century have been designed as huge cameras, not visual
telescopes.
Celestial bar codes
Not only are most modern telescopes
not used for visual observing, but most of the photographs taken
with such large telescopes are not what most people imagine a
picture to be. Instead of an image of a beautiful nebula or galaxy,
most of the photos look like celestial bar codes: Thousands of
thin, parallel vertical lines aligned in neat rows. It's as if
those huge telescopes were no more than giant bar code scanners
which in a way is exactly what they are. Those "bar
codes" are spectrograms, and spectrograms are the
basis of modern astronomy. Here's how they work:
If you take a prism and hold it up to a beam of sunlight, at a
certain angle of the prism the white light of the sun will be
separated into a rainbow of colors. If you were to carefully control
the incoming beam and analyze the "rainbow" very carefully,
you would note that it contains hundreds of very thin black lines,
each one corresponding to a specific chemical element in the Sun.
Those thin black lines (known as Fraunhofer lines for the
German optician who first catalogued them) are visible in the
spectrum of everything that glows in the universe. That gives
astronomers a power that is almost magical: It allows them to
do very detailed chemical analysis of distant objects without
ever coming near them. That is how we can look at a star millions
of light years away and know what is in it quite an amazing
thing.
Speed machines
And spectrograms can do even more: If
the pattern of lines in the spectrum are shifted a bit from their
normal positions, it tells us that the object is moving and how
fast it is moving. If the lines in the spectrum appear shifted
toward the blue end of the spectrum, the object is coming toward
us. If the lines are shifted toward the red, the object is moving
away from us. In either case, the amount of shift (which can be
very precisely measured) indicates the speed of the object.
Some of the speeds detected by use of spectrographs are downright
astonishing: Some galaxies whole huge galaxies have
been clocked at speeds of tens of thousands of miles per second,
or hundreds of millions of miles per hour. The discovery of galaxies
moving at such amazing speeds, and the fact that they were all
moving away from us, is what led to the formulation of the Big
Bang theory. The Big Bang theory is the foundational theory of
modern astronomy and cosmology, and it is owed completely to the
power of spectral analysis. Visual observing or taking conventional
photos of stars and galaxies would never have revealed the motions
of galaxies; it's been only by spectrographic analysis that we
have been able to discover not only their rapid motions but also
their detailed chemical make-up and even much of their histories.
And you can do it yourself
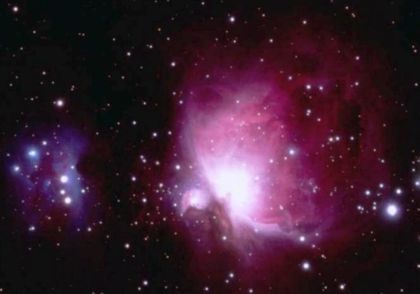
Spectral analysis may seem the exclusive realm of Ph.D.s using exotic equipment, but in fact some forms of spectral analysis require nothing more than a bit of clever knowledge. See, for example, this image of the Orion nebula:
Pink-red color of the Orion Nebula
indicates ionized hydrogen. Blue in NGC 1973-75-77 indicates gas
and dust that is not ionized, but which reflects light. Image copyright © Wil Milan.
Note that much of the nebula is a pinkish red color, the color
of ionized hydrogen; anytime you see that color in a nebula you
know not only that it is mostly made of hydrogen, but that the
hydrogen is being irradiated by nearby stars so that it is ionized
and glowing just like a neon sign. (A neon sign glows because
of ionized neon the same chemical principle applied to neon
gas instead of hydrogen.)
The peculiar shade of pink you see in this nebula is not a pure
pink, but actually has a faintly purple tinge to it. That's because
mixed in with the reddish color of hydrogen is a bit of blue-green,
the color of ionized oxygen, which is the other primary component
in the light of emission nebulae like this. So now anytime
you see a pinkish-red nebula with just a wee hint of purple, you
will know you are looking at the color signature of ionized hydrogen
and oxygen.
What about the blue portions? Blue indicates clouds of gas and
dust that are not close enough to bright stars to be ionized by
their radiation, but close enough to reflect the light from such
stars. These nebulae are therefore known as reflection nebulae,
because they are reflecting the light of nearby stars rather than
emitting their own light. And because the hottest, brightest stars
are usually blue, most reflection nebulae are blue as well.
So now you have the key: Next time you see a photo of a nebula,
you can amaze everyone by doing a bit of on-the-spot spectral
analysis. And reflect for a moment on how remarkable that is,
how it's one of the great fortunate coincidences of creation that
the delicate colors that stir the soul also bring us answers to
a great quest of the mind.
|
|
 |